
You check the news:
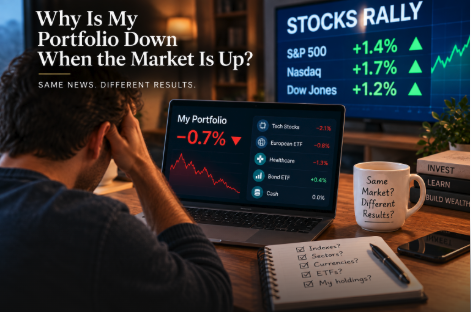
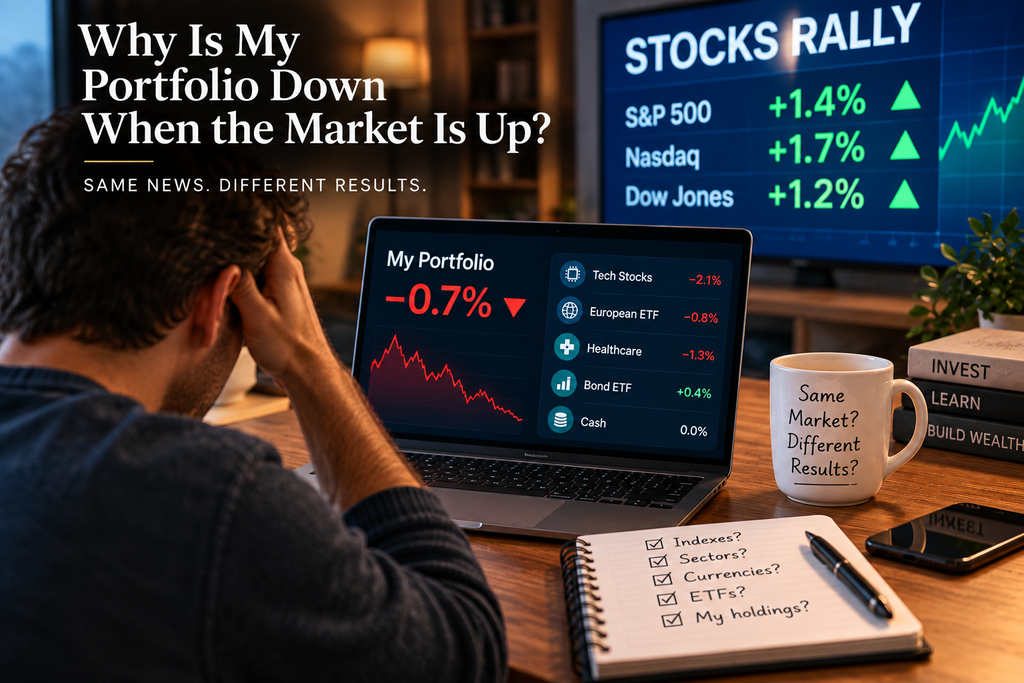
S&P 500: +1.4%
Nasdaq: +1.7%
Another headline says:
STOCKS RALLY
Then you open your investment app.
Your portfolio: -0.7%
What?
If “the market” went up, shouldn’t your investments have gone up too?
Not necessarily.
The headline is describing an index. Your app is describing your money.
Those can be two very different baskets of investments.
The Short Answer: You Don’t Own “The Market”
When financial media says:
“The market rose today”
it usually means one or more widely followed indexes rose.
That might be the:
- S&P 500;
- Nasdaq Composite;
- Dow Jones Industrial Average;
- DAX;
- FTSE 100;
- MSCI World.
But your portfolio has its own mix of:
- companies;
- position sizes;
- countries;
- sectors;
- currencies;
- asset classes.
Unless your portfolio closely tracks the particular index in the headline, there is no reason its daily return must match it.
Even two portfolios containing many of the same companies can behave differently if their weights are different.
What Does “The Market Is Up” Actually Mean?
Suppose a headline says:
MARKET UP 1%
That does not mean every stock gained 1%.
Inside that index, some companies may be up 5%.
Others may be down 3%.
Others may barely move.
The index combines those movements according to its methodology.
For example, the S&P 500 is a float-adjusted market-capitalisation-weighted index. Larger companies therefore have more influence on its movement than smaller constituents. S&P Global
So “the S&P 500 gained 1%” tells you what happened to that weighted index.
It does not tell you what happened to every U.S. stock, every ETF, or your portfolio.
A Simple Example: Market +1.4%, Portfolio -0.7%
Imagine this hypothetical portfolio:
| Holding | Weight | Daily return |
|---|---|---|
| Technology Stock A | 40% | -1.5% |
| Healthcare ETF | 25% | -1.0% |
| European ETF | 20% | +0.5% |
| Bond ETF | 10% | +0.2% |
| Cash | 5% | 0% |
Now apply each return to its portfolio weight.
Technology contribution:
40% × -1.5% = -0.60%
Healthcare:
25% × -1.0% = -0.25%
European ETF:
20% × +0.5% = +0.10%
Bonds:
10% × +0.2% = +0.02%
Cash:
0%
Combined:
approximately -0.73%
Your app could therefore show roughly:
-0.7%
while the S&P 500 is simultaneously up 1.4%.
Nothing has malfunctioned.
You simply do not own the same portfolio as the S&P 500.
Not Every Stock Has the Same Influence on an Index
This is one of the most important reasons headline indexes can feel disconnected from what individual investors experience.
In a market-cap-weighted index, bigger companies carry bigger weights.
S&P Dow Jones Indices explains that securities with larger market capitalisations have greater influence on the performance of a market-cap-weighted index. S&P Global
Imagine an index containing 100 companies.
Five enormous companies rise sharply.
Dozens of smaller companies fall modestly.
Because those five giants carry much more index weight, their gains could be enough to keep the overall index positive.
That is why asking:
“How many stocks went up?”
and asking:
“Did the index go up?”
are not always the same question.
Can “The Market” Rise While Many Stocks Fall?
Yes.
Imagine:
Five giant companies: strong gains.
Hundreds of smaller companies: modest declines.
Depending on the index and its weighting method, those large companies can have enough influence to keep the headline index positive.
This relates to market breadth, which broadly looks at how widely gains or losses are distributed across securities rather than focusing only on the index level.
You do not need to become a breadth analyst to understand the practical lesson:
An index being green does not mean everything inside it is green.
Your Portfolio Weights Matter Too
The same mathematics applies to your own investments.
Suppose you own ten stocks.
Nine rise 1%.
One falls 10%.
It is tempting to think:
“Nine out of ten went up, so I must be positive.”
But imagine the losing stock represents 40% of your portfolio, while the nine winners share the remaining 60%.
Loss from the large position:
40% × -10% = -4%
Gain from everything else:
60% × +1% = +0.6%
Approximate portfolio result:
-3.4%
Most holdings were green.
Most of your money was not.
Position size matters more than simply counting winners and losers.
One Bad Position Can Drag Down Everything Else
Take a €10,000 portfolio.
You have:
€4,000 in Company A
and:
€6,000 spread across everything else
Company A falls:
8%
Loss:
€320
The remaining €6,000 rises:
2%
Gain:
€120
Net change:
-€200
Portfolio return:
-2%
Most of the portfolio outside Company A did well.
But the concentrated position overwhelmed those gains.
That is precisely the kind of company-specific exposure discussed in Crown Altessa’s guide to what diversification actually does. Diversification cannot prevent portfolio losses, but it can reduce the influence of one holding on the whole result.
Your ETF May Not Track the Index in the Headline
A common reaction is:
“But I own ETFs.”
An ETF is a wrapper, not a guarantee that you own “the market.”
An ETF might track:
- the S&P 500;
- MSCI World;
- emerging markets;
- European equities;
- the Nasdaq-100;
- small companies;
- technology;
- healthcare;
- bonds;
- dividend-paying companies;
- one particular country.
If a news report says the S&P 500 rose while you own an emerging-markets ETF, there is no reason those two investments should behave alike.
Check the benchmark your ETF actually tracks.
MSCI itself maintains many different index methodologies, return types and geographic universes, which is why “I own an index ETF” still does not identify what market exposure you actually own. MSCI
Even Two “Global” ETFs Can Behave Differently
Labels such as:
global
world
international
all-world
can sound interchangeable.
They are not necessarily.
Two funds can differ in:
- countries included;
- emerging-market exposure;
- company-size exposure;
- sector weights;
- benchmark methodology.
Read the fund’s benchmark and holdings rather than relying on the name alone.
The same principle sits behind long-term portfolio construction: what you actually own matters more than the label attached to the investment.
Sector Exposure Can Explain the Difference
Imagine this hypothetical day:
Broad index: +1.0%
Technology: +2.5%
Energy: -2.0%
Healthcare: -1.2%
If the broad index has substantial exposure to the technology companies driving the rally while your portfolio is heavily tilted toward energy and healthcare, your portfolio could easily be negative.
Both numbers can be correct.
They are measuring different exposures.
Geography Matters
A U.S. financial-news headline saying:
“Stocks rallied today”
may primarily be talking about U.S. stocks.
But your portfolio might contain:
- European companies;
- Japanese equities;
- emerging markets;
- global funds;
- country-specific ETFs.
Imagine the S&P 500 gains 1.5% while European equities fall 0.6%.
An investor heavily exposed to Europe can have a negative day even while American financial television is describing a rally.
There is no contradiction.
Currency Can Change the Return You See
This is particularly relevant for European investors buying foreign assets.
Suppose a German investor owns U.S. stocks.
The underlying investment rises:
+2%
But over the same measurement period, the U.S. dollar falls approximately:
3% against the euro
The investor’s euro return is not simply +2%.
Currency and asset returns interact multiplicatively.
A simplified calculation is:
1.02 × 0.97 – 1 = approximately -1.1%
So an asset that gained 2% in dollar terms could still produce a negative result for a euro-based investor under that hypothetical currency movement.
Currency-hedged funds can behave differently, but hedging itself comes with its own mechanics and costs.
Bonds May Be Doing Something Completely Different
Suppose your portfolio is:
60% stocks
30% bonds
10% cash
Comparing the whole portfolio with a 100% equity index is not an apples-to-apples comparison.
Your bonds may rise less, fall, or behave differently from equities.
Cash does not participate in stock-market rallies at all.
That may be exactly what you intended.
Different assets have different jobs, much like the distinction Crown Altessa makes between cash and investing.
Cash Can Make You Lag a Rising Market
Imagine:
Portfolio value:
€10,000
Invested:
€7,000
Cash:
€3,000
Your investments gain:
10%
Investment gain:
€700
New portfolio value:
€10,700
Whole-portfolio gain:
7%
Your invested assets earned 10%.
Your portfolio earned 7%.
The 30% sitting in cash reduced participation in the rally.
It would also reduce the impact of an equivalent decline.
That is neither automatically good nor bad. It is simply the consequence of the allocation.
Fees Can Create Small Differences
Investment returns can also be affected by:
- fund expenses;
- trading costs;
- platform fees;
- bid-ask spreads.
These usually will not explain a huge one-day difference between a broadly diversified portfolio and a major index.
But they can help explain smaller deviations over time.
Vanguard notes that ETF expenses, trading costs, replication methods and taxes can contribute to the tracking difference between an ETF and its benchmark. Vanguard
Price Return vs Total Return Can Confuse Comparisons
Indexes can also be reported in different ways.
A price-return index measures price changes.
A total-return index also accounts for reinvested distributions such as dividends.
S&P Dow Jones Indices explicitly calculates both price-return and total-return versions of major indexes such as the S&P 500. S&P Global
If you compare a distributing ETF with one index figure and an accumulating ETF with another return series, apparent differences can arise simply because the comparison is not on the same basis.
Compare like with like.
Time Zones Can Make the Numbers Look Wrong
Global portfolios do not all trade on the same clock.
At one moment:
- Europe may already be closed;
- U.S. markets may still be trading;
- Asian markets may not yet have reopened;
- currencies may continue moving;
- your app may use a particular daily cut-off.
That means:
“S&P 500 today”
and:
“my portfolio today”
may not always represent precisely the same measurement window.
Usually this is a secondary explanation rather than the main one, but it can create confusing short-term discrepancies.
Your App May Be Showing a Different Type of Return
Check what the number actually says.
Your app might show:
Today’s gain/loss
Total gain/loss
Portfolio value change
Percentage return
Money-weighted return
Those are not necessarily interchangeable.
If you deposited or withdrew money during the period, some performance calculations can also differ from a simple change in account value.
Before investigating a mysterious return, verify what your broker is actually measuring.
This is a good example of why financial confidence comes from understanding the numbers rather than reacting to them.
What If You Actually Own an S&P 500 ETF?
Now for the harder question.
“Fine. But I really do own an S&P 500 ETF. The S&P 500 is up. Why isn’t my ETF showing exactly the same return?”
Small differences can arise from:
- fund expenses;
- tracking difference;
- quote timing;
- bid-ask spreads;
- currency conversion;
- distributing versus accumulating structure;
- trading-hour differences;
- comparing a price index with a total-return measure.
Vanguard defines tracking difference as the difference between an ETF’s return and the return of its benchmark over a given period and notes that costs are one factor affecting that gap. Vanguard
Tiny short-term differences may therefore be normal.
A large and persistent discrepancy from the fund’s stated benchmark deserves more investigation.
One Day of Underperformance Is Usually Not the Important Question
Suppose your portfolio loses:
0.5%
while a headline index gains:
1%
That single day does not establish that your portfolio is badly designed.
A useful performance comparison needs:
- an appropriate benchmark;
- a meaningful period;
- comparable risk;
- comparable asset exposure.
One day’s difference can simply reflect the portfolio you chose to own.
Persistent underperformance relative to an appropriate benchmark is a separate question.
Reacting emotionally to a single disappointing day can also produce worse decisions than the underperformance itself, which is why Crown Altessa’s article on why smart people make bad money decisions is relevant here.
When Should You Actually Investigate?
A closer look makes sense when:
- an ETF persistently differs substantially from its stated benchmark;
- you do not know what benchmark your ETF tracks;
- one holding has become much larger than intended;
- portfolio allocations have drifted materially from your plan;
- fees are much higher than expected;
- you misunderstood your currency exposure;
- your portfolio’s actual risk is very different from what you intended;
- persistent underperformance cannot be explained by different exposures.
The objective is not to chase whichever index performed best recently.
It is to understand whether your investments are behaving consistently with what they are designed to own.
A Five-Minute Portfolio Check
Open your portfolio and answer these ten questions:
- What benchmark am I comparing myself with?
- What percentage of my portfolio is in each holding?
- Which countries do I actually own?
- Which sectors dominate my portfolio?
- What currencies am I exposed to?
- How much sits in cash or bonds?
- What index does each ETF actually track?
- Am I comparing the same time period?
- Am I comparing price return with total return?
- Is one holding responsible for most of today’s loss?
Those ten answers will explain many apparent “market up, portfolio down” contradictions.
Three “Market Up, Portfolio Down” Scenarios
Scenario 1: Concentrated Investor
Headline index:
+1.2%
Portfolio:
-1.5%
Reason:
A stock representing 35% of the portfolio falls sharply and overwhelms gains elsewhere.
The index and portfolio contain different weights.
Scenario 2: European Global Investor
S&P 500:
+1.5%
Portfolio:
-0.3%
Reason:
The investor has substantial European and emerging-market exposure, plus currency movements affecting foreign holdings.
The S&P 500 is not an appropriate description of the entire portfolio.
Scenario 3: Diversified 60/30/10 Investor
Stock index:
+2%
Portfolio:
+1%
Portfolio:
60% stocks
30% bonds
10% cash
Only part of the portfolio participated fully in the stock rally.
Nothing about that result automatically indicates a problem.
Common Misconceptions
“The market is up, so all stocks must be up.”
False. An index can rise while many constituents fall.
“My ETF should move exactly like the S&P 500.”
Only if it actually tracks the S&P 500, and even then small tracking differences can occur.
“Most of my holdings are green, so my portfolio must be green.”
Not if a large losing position outweighs several smaller winners.
“If my portfolio loses money on an up day, something is wrong.”
Not necessarily. Your exposures may simply differ.
“A global ETF owns everything equally.”
No. Funds follow specific benchmarks with specific weights.
“Cash doesn’t affect my return.”
It does at the whole-portfolio level.
“An index is the entire market.”
No. An index is a defined basket constructed according to a methodology.
Frequently Asked Questions
Why Is My Portfolio Down When the Market Is Up?
Usually because the index in the headline and your portfolio contain different investments, weights, sectors, countries, currencies or asset classes.
Can the S&P 500 Rise While Many Stocks Fall?
Yes. Because the S&P 500 is float-adjusted market-cap weighted, larger companies have more influence on its return. Strong gains among large constituents can offset declines elsewhere. S&P Global
Why Is My ETF Down When the S&P 500 Is Up?
Your ETF may track another index, hold different countries or sectors, be affected by currency movements, or simply be measured over a different period.
If it genuinely tracks the S&P 500, small differences can also result from fees, tracking difference and timing.
Can Currency Make My Portfolio Fall?
Yes. For an investor measuring returns in euros, a foreign asset can rise in its local currency while an adverse exchange-rate movement reduces or even reverses the euro-denominated return.
Why Are Most of My Stocks Up but My Portfolio Down?
Because portfolio return is determined by weights, not by the number of winning positions.
One large loser can outweigh several smaller winners.
Should My Portfolio Match the Market?
Only if it was deliberately designed to track that particular market benchmark closely.
A mixed portfolio containing stocks, bonds, cash or investments from several regions should not be expected to behave exactly like one stock index.
How Do I Know What Benchmark to Compare My Portfolio With?
Start with what you actually own.
A useful benchmark should reflect similar asset classes, regions and risk exposure. A U.S. large-cap stock index is usually a poor comparison for a portfolio dominated by European equities, bonds and cash.
Conclusion
The news says:
S&P 500: +1.4%
Your portfolio says:
-0.7%
Those numbers do not contradict each other.
They may represent completely different baskets of assets with different:
- weights;
- sectors;
- countries;
- currencies;
- asset classes;
- measurement periods.
Your first question therefore should not be:
“Why didn’t my portfolio follow the market?”
It should be:
“Which market am I actually comparing my portfolio with?”
For a broader beginner-friendly foundation covering saving, investing and building a financial plan, Personal Finance Made Simple for Beginners is available on Gumroad and Amazon.
Before asking why your portfolio didn’t follow the market, first ask which market you actually own.
Feeling financially stuck?
When financial pressure becomes constant, long-term decisions start feeling emotionally heavy.
The Crown Altessa newsletter was created to help people rebuild clarity slowly and strategically through practical financial frameworks, long-term thinking, and structured decision-making insights.
Join the newsletter and receive:
• the free Financial Foundation Guide
• strategic financial insights
• practical tools for long-term stability
• frameworks designed to reduce financial overwhelm
Start building financial clarity one step at a time.