
You invest €10,000 in an ETF.
Its expense ratio is 0.20%.
At first glance, that number looks almost meaningless. Two-tenths of one percent.
But what does it actually mean? Do you pay €20? When? Does €20 leave your bank account? And what happens if you keep the ETF for 20 or 30 years?
At a constant €10,000 investment value, 0.20% represents approximately €20 per year. But you normally never see a €20 invoice. The fund pays its operating expenses from its assets, which reduces the investment return you ultimately receive. The SEC describes ETF expense ratios as annual operating expenses expressed as a percentage of the fund’s average net assets. (Investor)
Small does not mean irrelevant. A fraction of a percentage point can become meaningful when it applies to a large portfolio for decades.
What Is an ETF Expense Ratio?
An ETF expense ratio is the annual operating cost of the fund expressed as a percentage of its assets.
Depending on the fund and regulatory framework, those operating costs can include expenses associated with:
- investment management;
- administration;
- custody;
- accounting;
- legal and regulatory work;
- other costs included in the fund’s disclosed operating expenses.
The precise categories are not identical for every fund. The fund’s prospectus or other official documentation provides the relevant fee information. In the United States, the SEC requires funds to disclose operating expenses in a standardized prospectus fee table. (Investor)
European investors will also commonly encounter the term TER, or Total Expense Ratio, as well as terms such as ongoing charges in fund documentation. Terminology and disclosure rules can vary by market, so it is worth checking exactly what the figure shown by your fund represents.
The basic idea remains simple: the percentage tells you how much running the fund costs relative to its assets.
What Does a 0.20% Expense Ratio Actually Cost?
For a quick estimate, multiply the amount invested by the expense ratio.
Suppose your ETF holding is worth €10,000.
With an expense ratio of 0.20%:
€10,000 × 0.002 = approximately €20 per year
At the same €10,000 asset level:
| Expense ratio | Approximate annual cost |
|---|---|
| 0.10% | €10 |
| 0.20% | €20 |
| 0.50% | €50 |
| 1.00% | €100 |
These figures are illustrations, not literal annual invoices.
They assume the investment remains worth €10,000 for the purpose of making the percentage easy to understand. In reality, ETF values fluctuate throughout the year, and expense ratios are calculated against fund assets rather than a permanently fixed personal balance. (Investor)
Where Does the Fee Actually Come From?
This is where ETF fees confuse many investors.
You normally never see the bill.
You generally do not receive an invoice saying:
ETF operating expenses: €20
Nor does the fund normally withdraw €20 from your bank account once a year.
Operating expenses are paid from the fund’s assets. The SEC explains that investors therefore pay them indirectly: when expenses are paid from fund assets, they reduce the value of the fund and, consequently, the value attributable to shareholders compared with a world in which those expenses did not exist. (Investor)
Think of the expense ratio as being built into the fund’s results rather than billed like Netflix.
It should not be imagined as one annual deduction on a particular date. The cost is reflected through the fund’s ongoing operation and net performance.
That is why you can own an ETF for years without seeing an explicit expense-ratio transaction on your brokerage statement.
Is the Expense Ratio Charged on What You Invested or What the ETF Is Worth?
The expense ratio relates to the fund’s assets, not simply the amount you originally invested years ago.
Suppose you invest €10,000 in an ETF charging 0.20%.
The simple illustration gives us approximately €20 annually at that asset level.
If your holding later becomes worth around €15,000, 0.20% of €15,000 is approximately €30.
If it falls to around €8,000, the comparable calculation is about €16.
These are deliberately simplified illustrations rather than a description of the fund’s precise daily accounting. The point is that the economic cost changes with the value of the assets.
Why Small Percentages Matter Over Time
Consider three hypothetical funds.
Each starts with €10,000.
Assume, purely for illustration, that the underlying investments produce a constant 7% annual gross return before fund costs for 30 years.
The only assumed difference is the expense ratio:
- Fund A: 0.10%
- Fund B: 0.50%
- Fund C: 1.00%
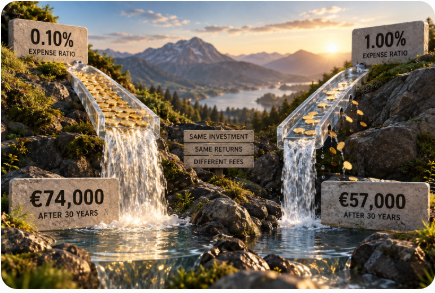
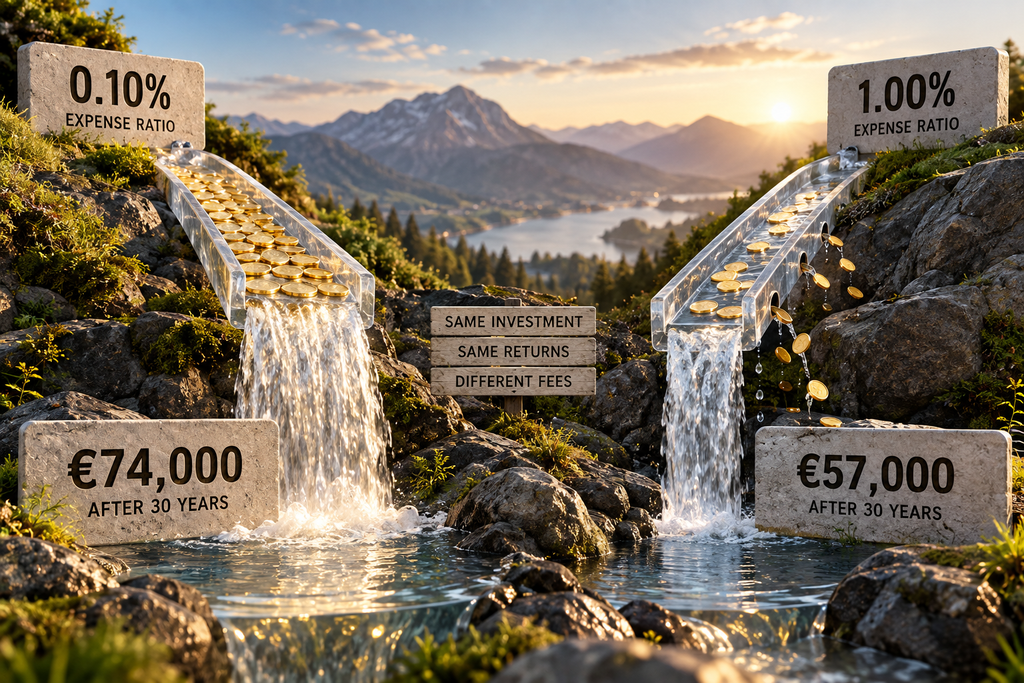
Using a simplified calculation in which the expense ratio reduces the annual return, the approximate ending values are:
| Expense ratio | Simplified net annual return | Approximate value after 30 years |
|---|---|---|
| 0.10% | 6.90% | €74,017 |
| 0.50% | 6.50% | €66,144 |
| 1.00% | 6.00% | €57,435 |
The difference between the 0.10% and 1.00% examples is roughly €16,582 after 30 years.
This is a hypothetical mathematical illustration, not a return forecast. Real markets do not produce a steady 7% every year, fund returns will differ, and the calculation excludes taxes, brokerage costs and other potential expenses.
Still, it demonstrates why the SEC warns that even relatively small differences in fund fees can produce meaningful differences in long-term investment results. (Investor)
A 0.20% Fee Is Not Just €20 Forever
The €20-per-€10,000 calculation is useful, but incomplete.
If an investment grows, the euro value associated with a percentage-based expense grows too.
There is also a compounding effect: money absorbed by expenses is money that is no longer participating in future investment growth.
That effect may seem negligible over one year. Over several decades and a much larger portfolio, the difference can become more noticeable.
This is the same mathematical principle behind long-term compounding more generally. What makes fees unusual is that compounding works in the opposite direction: recurring costs reduce the capital left to compound.
Expense Ratio vs Brokerage Commission
An ETF expense ratio and a brokerage commission are different costs.
Expense ratio: an ongoing fund-level operating cost.
Brokerage commission: a transaction charge a broker may impose when you buy or sell.
Depending on your broker and market, a trade might have:
- a fixed commission;
- a percentage-based commission;
- no explicit commission.
A commission-free ETF trade does not mean owning or trading the ETF is necessarily cost-free.
The ETF can still have an expense ratio, and other costs or trading frictions may apply. The SEC specifically warns that a low or even zero stated expense ratio does not necessarily capture every cost an investor can incur. (Investor)
Price and cost are not the same thing.
Expense Ratio vs Bid-Ask Spread
ETFs trade on exchanges, which introduces another cost: the bid-ask spread.
Suppose an ETF shows:
Bid: €99.95
Ask: €100.05
The spread is:
€0.10
The bid is what buyers are currently offering; the ask is what sellers are asking.
That gap creates trading friction when entering or exiting a position. It is separate from the ETF’s annual expense ratio. iShares likewise distinguishes the ongoing fund charge from platform fees, dealing costs and the bid-ask spread when comparing ETF costs. (BlackRock)
For someone trading frequently, spreads and brokerage charges can therefore matter alongside the headline expense ratio.
Expense Ratio vs Tracking Difference
This distinction is particularly useful when comparing index ETFs.
The expense ratio or TER tells you the fund’s stated operating cost.
Tracking difference measures the difference between the ETF’s actual return and the return of the index it is trying to follow. iShares describes it as the gap between the ETF’s return and its benchmark index. (BlackRock)
An ETF with a 0.20% TER does not necessarily lag its index by exactly 0.20%.
Actual tracking can also be influenced by factors such as:
- portfolio sampling;
- internal trading costs;
- securities lending;
- tax treatment inside the fund;
- replication method;
- cash held by the fund.
Some of these influences can hurt tracking, while others can partially offset expenses.
So two ETFs with similar TERs can still produce different tracking results.
When comparing index funds, the stated fee tells you something important. Actual tracking tells you something different.
Is the Cheapest ETF Always the Best ETF?
No.
Cost deserves attention, but it is one part of the investment.
Other relevant characteristics can include:
- which index the ETF tracks;
- fund size;
- liquidity;
- tracking quality;
- replication method;
- domicile;
- applicable tax treatment;
- accumulating or distributing structure;
- broker availability;
- bid-ask spread.
A 0.07% ETF tracking one index is not automatically better than a 0.15% ETF tracking a fundamentally different index.
They may not even be substitutes.
This is why ETF costs should be compared after establishing that the funds provide the exposure you actually want. iShares makes the same point: a lower-cost ETF is not necessarily the better choice if it provides different market coverage or follows a different investment approach. (BlackRock)
Compare like with like.
If you are still deciding between individual shares and funds rather than comparing ETFs themselves, that is a different question from the fee analysis covered here.
When Expense Ratios Matter More
Fee differences become more consequential when:
- the investment horizon is long;
- the portfolio is large;
- two funds are otherwise very similar;
- expected investment returns are relatively modest;
- the fee difference itself is large.
The difference between 0.10% and 0.20% is 0.10 percentage points.
The difference between 0.10% and 1.50% is 1.40 percentage points.
Those are very different cost gaps.
There is no single expense ratio that can responsibly be labelled “good” or “bad” across every ETF strategy. A specialised strategy may have a very different cost structure from a broad market index fund.
The useful comparison is against genuinely comparable alternatives.
When Expense Ratios Matter Less
A tiny fee difference can become less important when switching would introduce other disadvantages.
For example:
- the ETFs track different indexes;
- selling would create tax consequences;
- spreads or transaction costs are significant;
- the existing ETF is more liquid;
- changing funds complicates the portfolio;
- the investment amount is small.
An investor should not create €100 of transaction friction to chase €5 of estimated annual fee savings without considering how long it would take to recover the switching cost.
Likewise, cost alone tells you little about whether the underlying investment fits your long-term financial strategy.
Should You Switch ETFs Because Another One Is 0.05% Cheaper?
Not automatically.
Suppose your current ETF charges:
0.20%
A comparable alternative charges:
0.15%
Difference:
0.05 percentage points
On €10,000, that difference represents approximately:
€5 per year at that asset level.
On €500,000, it represents approximately:
€250 per year.
Scale matters.
Before switching, compare:
- whether the ETFs really provide equivalent exposure;
- potential taxes;
- trading commissions;
- bid-ask spreads;
- tracking difference;
- liquidity;
- any other relevant structural differences.
For €10,000, a 0.05-point difference may be financially minor. For a very large portfolio held over many years, it deserves more attention.
The calculation gives you context. It does not automatically tell you to switch.
How to Compare ETF Costs Properly
A practical comparison can follow seven steps:
- Confirm that the ETF tracks the strategy or index you actually want.
- Check its expense ratio, TER or applicable ongoing-charge figure.
- Review historical tracking difference where relevant.
- Look at liquidity and bid-ask spreads.
- Check broker trading and platform costs.
- Consider tax consequences relevant to your jurisdiction and circumstances.
- Compare genuinely similar funds.
Do not choose the investment first by sorting a screener from cheapest to most expensive.
The underlying investment still comes first.
Once you have comparable funds, costs become much more useful.
A Simple ETF Fee Calculator
For a quick estimate:
Portfolio value × expense ratio = approximate annual fund cost at that asset level
Example:
€25,000 × 0.20% = approximately €50
Here is the same calculation across different portfolio sizes:
| Portfolio value | 0.10% | 0.20% | 0.50% | 1.00% |
|---|---|---|---|---|
| €10,000 | €10 | €20 | €50 | €100 |
| €50,000 | €50 | €100 | €250 | €500 |
| €100,000 | €100 | €200 | €500 | €1,000 |
| €500,000 | €500 | €1,000 | €2,500 | €5,000 |
Again, these are simplified annualised illustrations assuming the stated portfolio value. Your actual investment value changes over time, so the economic cost will change with it.
The table is useful because percentages that look tiny become easier to evaluate when translated into euros.
Common ETF Fee Mistakes
Several misunderstandings appear repeatedly:
- treating the expense ratio as a one-time fee;
- expecting a visible annual invoice;
- comparing unrelated ETFs only by TER;
- ignoring bid-ask spreads;
- forgetting brokerage or platform costs;
- assuming the cheapest ETF must be the best;
- ignoring tracking difference;
- switching funds for tiny fee savings without considering taxes and transaction costs;
- assuming “commission-free” means cost-free.
The expense ratio is important precisely because it is easy to overlook. But it should not be mistaken for the total cost of owning and trading an ETF. (Investor)
Frequently Asked Questions
What Is a Good ETF Expense Ratio?
There is no universal number.
The appropriate comparison depends on the ETF’s strategy and the cost of genuinely similar funds. A broad index ETF and a specialised strategy can have very different cost structures.
Compare like with like rather than applying one fee threshold to every ETF.
How Is an ETF Expense Ratio Charged?
The fund generally pays its operating expenses from fund assets. Investors therefore bear the cost indirectly through the fund’s net value and returns rather than receiving a separate expense-ratio bill. (Investor)
Do I Pay ETF Fees Every Year?
The expense ratio represents ongoing annual fund operating expenses while you remain invested. It should not be understood as one visible annual charge on a specific date.
Does the Expense Ratio Come Out of My Bank Account?
Normally, no. Operating expenses are paid from the ETF’s assets rather than being separately withdrawn from your personal bank account. (Investor)
What Does a 0.20% Expense Ratio Mean?
As a simplified illustration, it represents approximately €20 annually for every €10,000 of assets at that value.
If your investment value changes, the euro amount associated with that percentage changes too.
Is TER the Same as Expense Ratio?
They express closely related concepts, but terminology and the precise scope of disclosed costs can vary by jurisdiction and fund documentation. Do not assume every fee label used internationally includes exactly the same items. Check the ETF’s official documentation.
Should I Choose the ETF With the Lowest Fee?
Not automatically.
First compare the index or strategy, tracking, liquidity, structure and other relevant characteristics. Then compare costs among funds that are genuinely suitable alternatives.
Conclusion
ETF fees are easy to ignore because investors rarely receive a visible bill.
Invisible does not mean irrelevant.
A 0.10% or 0.20% expense ratio may be entirely reasonable for a particular ETF. What matters is understanding:
- what the fund costs;
- what you receive for that cost;
- how it compares with genuinely similar alternatives;
- how much the difference matters at your portfolio size and time horizon.
For readers building their broader understanding of saving and investing, Personal Finance Made Simple for Beginners is available on Gumroad and Amazon.
Compare ETF fees carefully, but compare the investment first.
Feeling financially stuck?
When financial pressure becomes constant, long-term decisions start feeling emotionally heavy.
The Crown Altessa newsletter was created to help people rebuild clarity slowly and strategically through practical financial frameworks, long-term thinking, and structured decision-making insights.
Join the newsletter and receive:
• the free Financial Foundation Guide
• strategic financial insights
• practical tools for long-term stability
• frameworks designed to reduce financial overwhelm
Start building financial clarity one step at a time.